If you’ve ever opened a report filled with numbers and thought, “Okay… but what do I actually do with this?”—you’re not alone. Data is everywhere in digital marketing, but clarity is rare. That’s exactly where a well-built digital marketing dashboard comes in.
A dashboard isn’t just a pretty collection of charts. When done right, it becomes a decision-making tool, not a passive report. It tells you what’s working, what’s broken and where to focus next—without making you dig through endless spreadsheets.
Let’s break down how to create a digital marketing dashboard that actually drives smart, confident decisions.
Start With Decisions, Not Data
The biggest mistake marketers make is starting with metrics instead of outcomes. Before you open any tool or template, ask yourself one simple question:
“What decisions should this dashboard help me make?”
Some examples:
- Should I increase or reduce ad spend?
- Which channel deserves more attention this month?
- Where are we losing potential customers?
- Are our efforts contributing to real business growth?
When you design your dashboard around decisions, everything else becomes easier. Every metric you include must earn its place by supporting an action.
Choose Metrics That Tell a Story
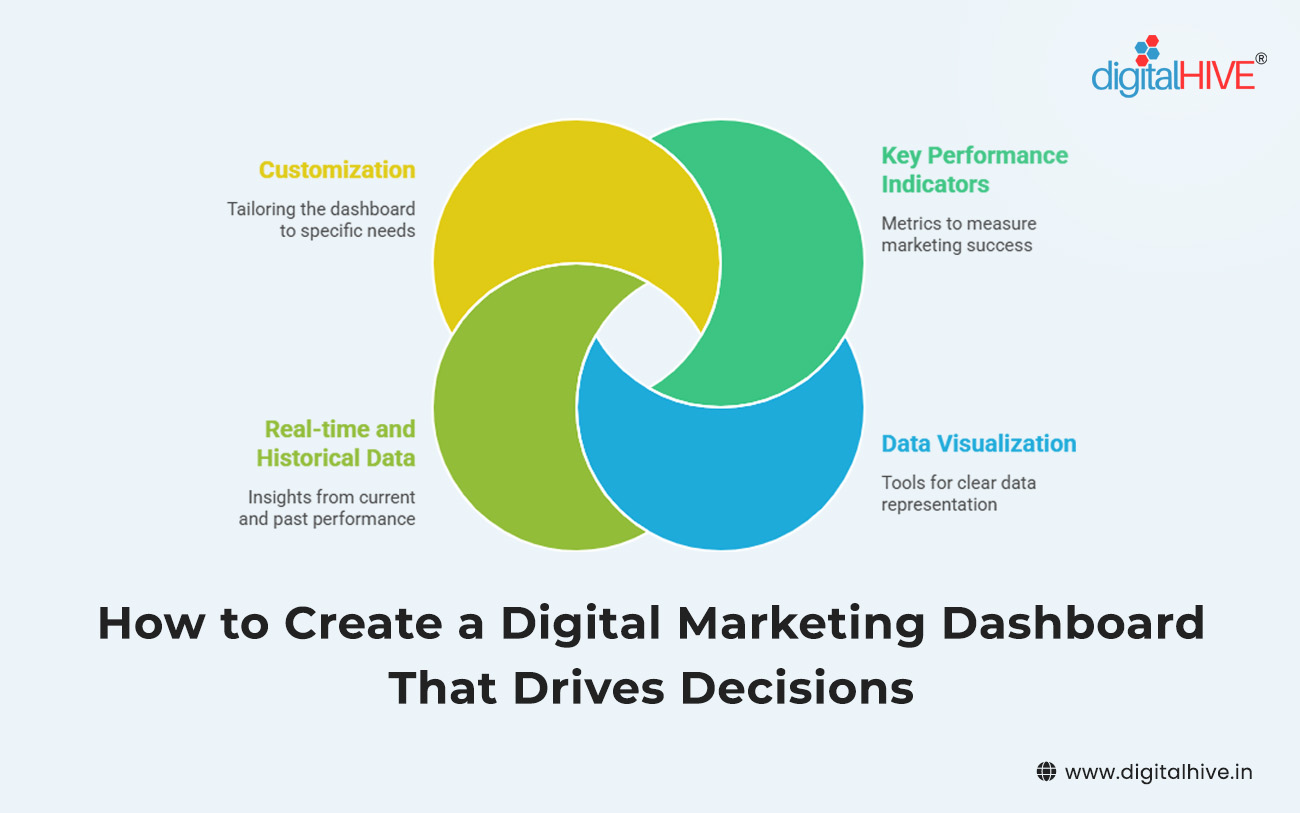
A strong dashboard feels like a story unfolding, not a math exam. Instead of tracking everything, focus on key performance indicators that show progress from awareness to conversion.
A practical structure looks like this:
- Visibility metrics (how many people see you)
- Engagement metrics (how they interact)
- Conversion metrics (what actions they take)
- Outcome metrics (revenue or value created)
This flow helps you quickly spot where things are going wrong. If traffic is high but conversions are low, the problem isn’t visibility—it’s experience or messaging.
Remember: more data doesn’t mean better insight. Fewer, meaningful metrics almost always win.
Keep It Focused and Purpose-Driven
One dashboard should serve one main purpose. Trying to fit everything into a single view usually leads to confusion.
You may need separate dashboards for:
- Overall performance tracking
- Campaign-level analysis
- Channel-specific insights
- Leadership or stakeholder reporting
Each one should answer a clear question. If a metric doesn’t support that purpose, leave it out. A focused dashboard saves time and builds confidence in your data.
Design for Humans, Not Analysts
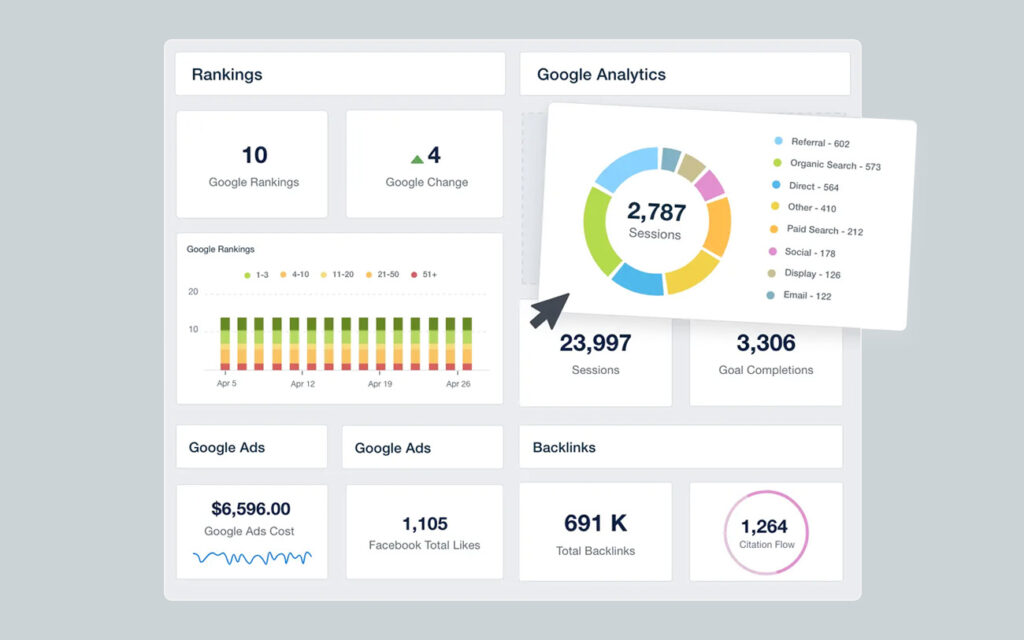
A dashboard is only useful if people actually use it. That means prioritizing visual clarity and simplicity over complexity.
Some design principles that work:
- Use clear labels instead of technical jargon
- Stick to consistent colors and formats
- Highlight important numbers using size or contrast
- Avoid overcrowding—white space is your friend
Your goal is to make insights instantly understandable. Someone should be able to glance at the dashboard and know whether things are going well or need attention.
Add Context, Not Just Numbers
Numbers alone don’t drive decisions—context does. A 20% drop sounds alarming until you realize it’s seasonal. A spike looks exciting until you see it came from low-quality traffic.
To make your dashboard more actionable:
- Compare metrics to previous periods
- Show benchmarks or targets where possible
- Use annotations to explain unusual changes
Context turns raw data into insight and prevents knee-jerk reactions based on incomplete information.
Make Trends More Important Than Snapshots
Daily numbers can be misleading. A good dashboard emphasizes patterns over time, not just isolated moments.
Line charts, rolling averages and month-over-month views help you see:
- Whether growth is sustainable
- If performance is improving or declining
- How changes affect results long-term
Trends are what guide strategic decisions. Snapshots are just noise without them.
Automate Data Collection Wherever Possible
Manual updates kill momentum and trust. If people suspect the data is outdated, they stop using the dashboard altogether.
Automation ensures:
- Consistent, up-to-date reporting
- Fewer human errors
- More time spent analyzing instead of compiling
Once automation is in place, the dashboard becomes a living tool, not a monthly chore.
Build for Action, Not Reporting
A decision-driven dashboard doesn’t end with information—it points toward action.
Helpful additions include:
- Clear indicators for underperformance
- Simple notes on recommended next steps
- Visual cues that flag urgent issues
When someone opens the dashboard, they shouldn’t just understand what happened. They should know what to do next.
Review, Refine and Remove Regularly
Your business goals will evolve and your dashboard should evolve with them. What mattered six months ago may not matter today.
Make it a habit to:
- Review dashboard usage
- Remove metrics no one references
- Update goals and benchmarks
- Simplify wherever possible
A lean, relevant dashboard is far more powerful than an impressive but bloated one.
Creating a digital marketing dashboard that drives decisions isn’t about tracking everything—it’s about tracking what matters. When you design with clarity, focus and real-world actions in mind, your dashboard becomes more than a reporting tool. It becomes a daily guide for smarter marketing choices.
By starting with decisions, choosing meaningful metrics, adding context and designing for humans, you transform data into direction. And in a world overflowing with information, clear direction is the real competitive advantage.
Build your dashboard to serve decisions first and the results will follow.
Tags: digital marketing analytics, digital marketing dashboard, KPI dashboard, marketing reporting tools